

How I Select Systematic Investment Strategies - and Why Your Values Matter in Investing
Many of you know my passion for data engineering, machine learning and, specifically, applying that knowledge to financial markets.
In this article I want to share the framework I use personally and at Corbex Funds Management, to evaluate systematic investment strategies for my own family capital.
There are thousands of possible strategies. With enough data, parameters and computing power, it is surprisingly easy to produce a historical chart that looks impressive.
The difficult question is different:
Which strategy produces enough return while behaving in a way that is aligned with how I want to invest?
My framework starts with values, then downside risk, then recovery, and only after that moves to return and statistical quality. This article explains how I selected Arbiter Investment Strategy to deploy capital automatically to the market.
Chapter 1 - Values and Investment
Investment and wealth management have an alignment problem: investments should align with the goals, constraints and values of the individual, organization or family capital.
Those values can include:
time horizon - how long to invest;
preservation versus growth - do I want preserve or grow capital aggressively;
acceptable drawdown - what is my tolerance to financial loss;
acceptable time to recovery - how long I accept to sit with losses;
volatility - do I want smooth return or I willing to participate in volatile market regimes;
liquidity - do I want to have opportunity to exit from deals immediately per my decision or willing to sit in market until my goals reached;
concentration - do I deeply believe in a series of good picks or I choose to invest into wide equity market overall;
tax considerations - what is my tax situation and how my time horizon for capital allocation leads to my tax bottom line;
leverage - am I willing to increase volatility for higher returns;
and many others.
There is therefore no universally “best” investment strategy. Only that are fit best for a series of constraints defined by personal values.
A strategy can be excellent for one investor and completely inappropriate for another, given the values and circumstance. Each strategy can be defined by many statistical measures on past performance, and this article maps exactly that.
Personal Values → Investment Requirements → Strategy Metrics → Strategy Selection
For me, in strategy selection, the objective is relatively simple:
I want to participate in the market’s long-term ability to compound capital while materially reducing participation in severe market drawdowns.
In other words, I aim at good returns and good timing to reduce draw down. This value system determines which statistics I care about. It can be distilled in this process:
Chapter 2 - Systematic Strategy Measures
If we are to select investment strategy, we should review its characteristics by investigating that particular strategy measures and performance metrics. Most quantitative strategy measures and metrics can be grouped into two broad categories.
1. Where did we end up?
These describe the economic result (total and on average year):
CAGR;
cumulative return;
maximum drawdown;
relative return to the benchmark.
2. How did we get there?
These describe the path:
volatility;
Sharpe ratio;
Sortino ratio;
underwater duration;
beta;
correlation.
Two strategies can produce the same ending wealth while providing completely different investment experiences.
The investment process is heavily path dependent, how you get to the results often more important than the final result itself.
Let me share my preferred list of strategy measures:
Maximum Drawdown and Relative Drawdown to Benchmark
Maximum Underwater Duration
Calmar Ratio
CAGR and Relative CAGR
Sharpe Ratio
Beta
Maximum Drawdown
Maximum drawdown measures the largest decline from a previous portfolio peak:

For me, this is one of the most important measures. Volatility is statistical and ephemeral in a sense due to dependency on path that volatility took.
Drawdown on the other hand is what an investor actually experiences as losing money.
What is historically largest drop from the top?
Definition: Maximum Drawdown
Underwater Duration
Drawdown depth tells us how much we lost. Underwater duration tells us how long we had to wait to recover.
An excellent example is a NASDAQ index that tracks most valuable 100 US tech stocks. It took 15 years to recover from Drawdown from peak of dotCom bubble.
Approximately March 2000 to February 2015.
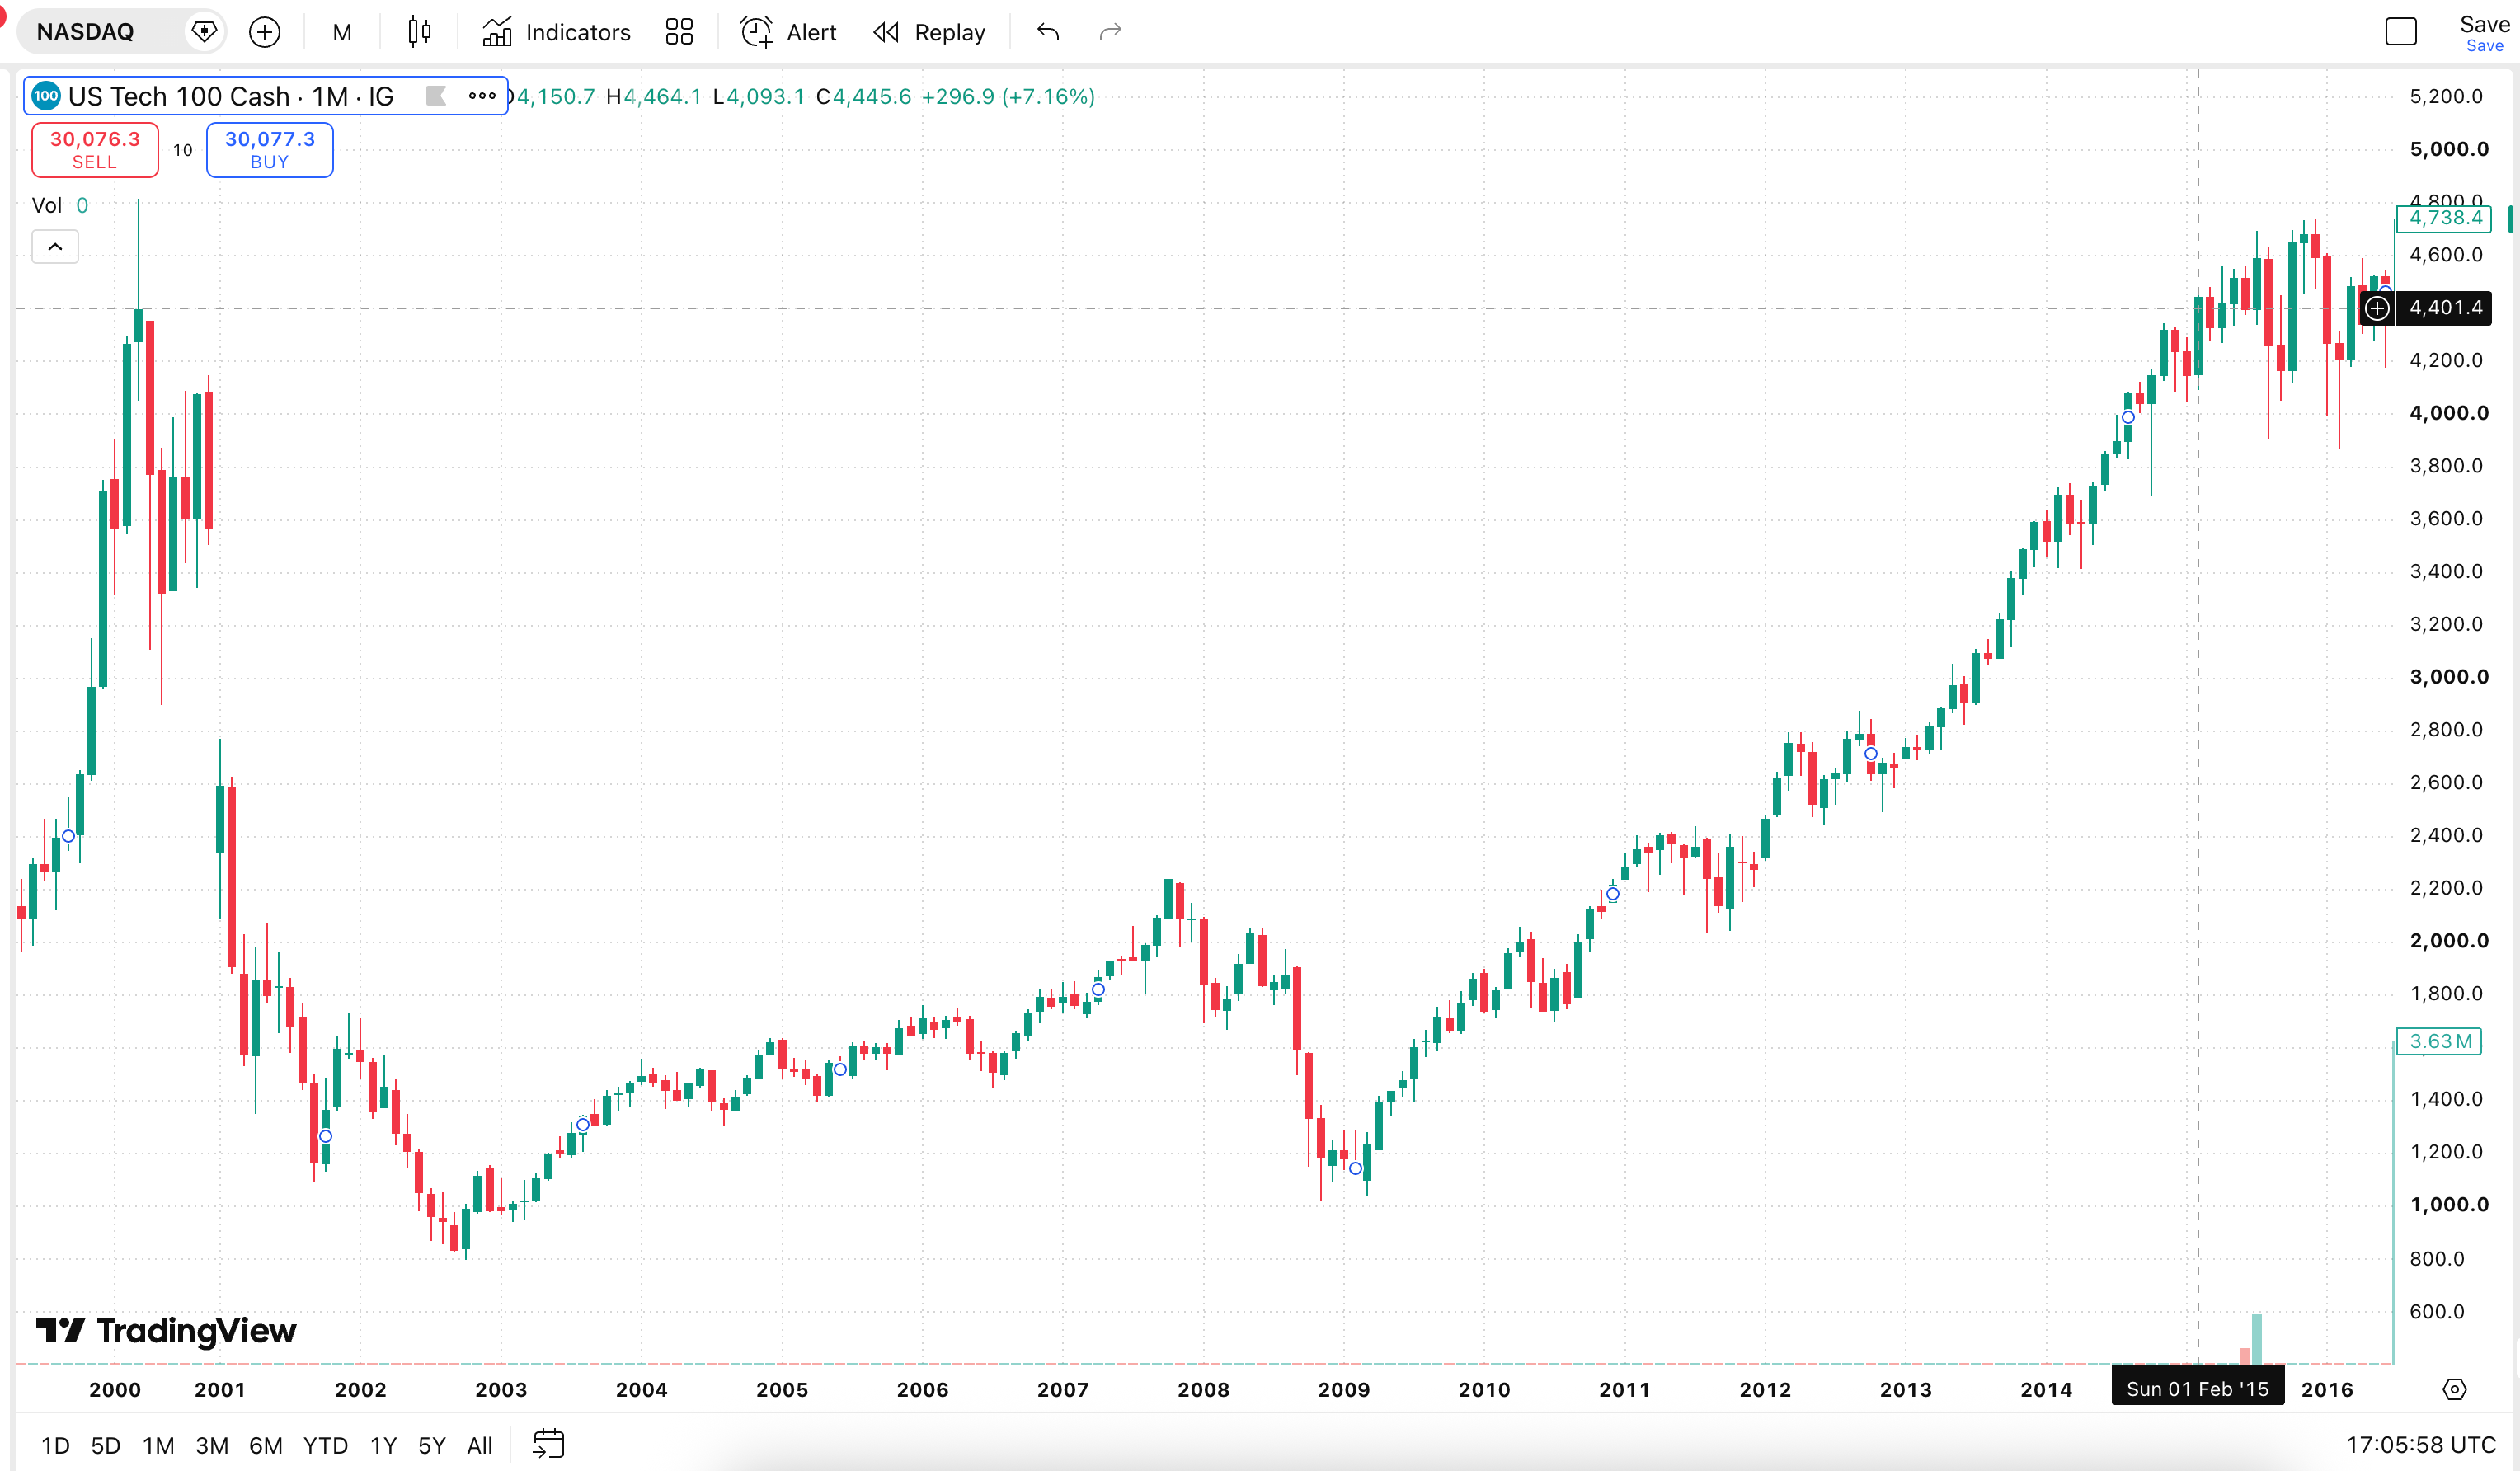
A strategy that loses only 15% but requires three years to reach another high may still be unattractive. I therefore consider drawdown depth and duration together.
How long it took to recover from largest drop from the top?
CAGR
Compound Annual Growth Rate measures annualized compounding:

It is probably the most intuitive measure of long-term investment growth. But CAGR alone tells us nothing about the path required to achieve it.
What is average annual return per year if I stay invested into strategy for a long time?
Definition: CAGR
Calmar Ratio
Calmar relates annualized growth to maximum drawdown:

I interpret it as a simple question:
How much annualized compounding did the strategy historically produce relative to its worst loss?
It tells me about capacity of strategy do recovery per unit of average return per annum.
Definition: Calmar Ratio
Sharpe Ratio
Sharpe measures excess return relative to volatility:

In simple terms:
How much return above the risk-free alternative did the strategy generate per unit of volatility?
This is primarily a measure of the quality of the return path.
Market typical Sharpe Ratio is about 0.5-0.7. Good strategy shows above 1. Elite strategies shows above 1.5.
This is key measure of volatility and the final result of the strategy. It mixing together ability to produce above risk free return and shape of the return. High return with volatile path can have sharpe ration below 1 and low volatile low return path can have sharpe above 1.
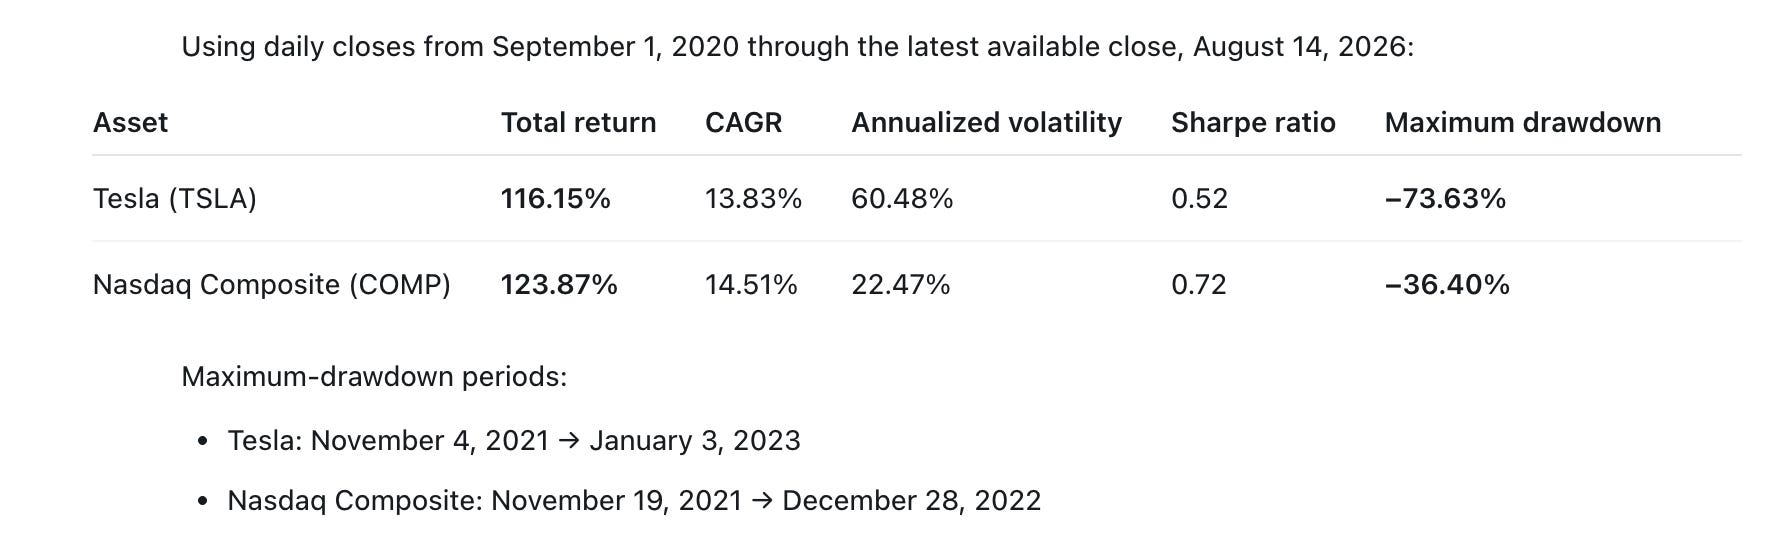
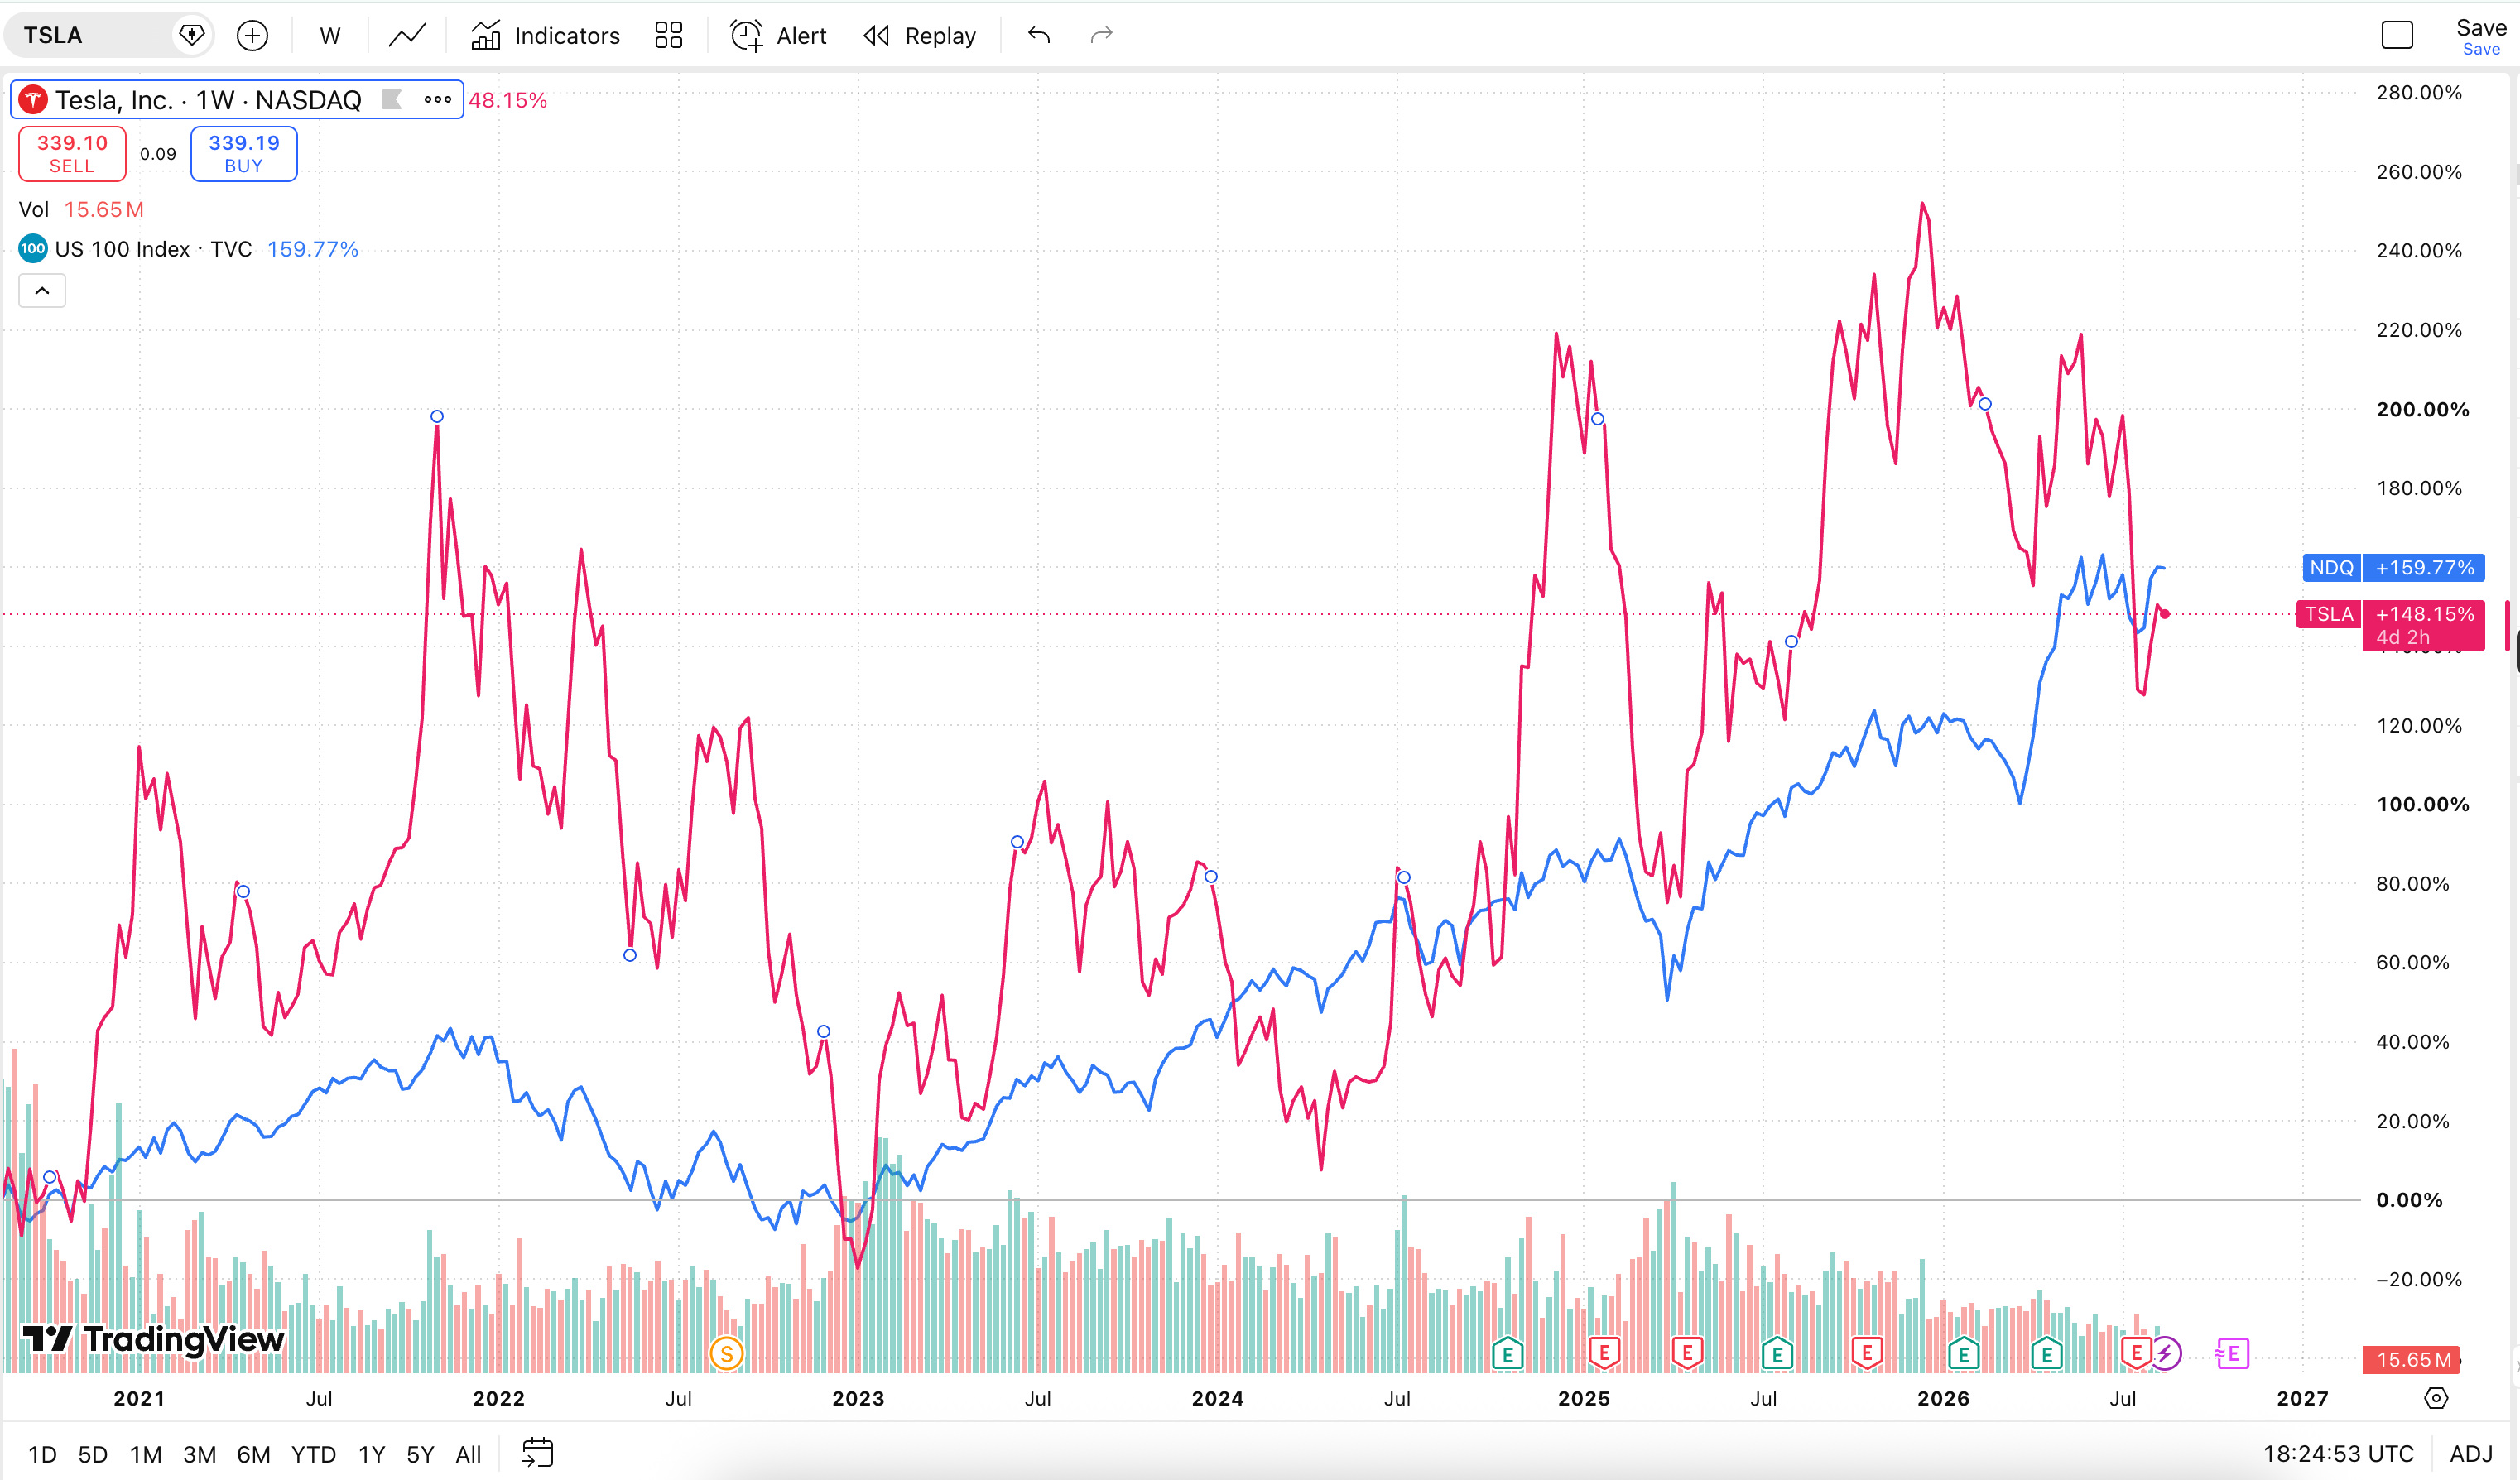
Example below of two similar returns of about +150% for period from September 1st, 2020 for NASDAQ and Tesla Inc. But these returns and instruments has different path. Tesla is dramatically more volatile than NASDAQ, that leads to these measures:
Tesla: High annualize volatility led to low sharpe ratio of 0.5
NASDAQ: Lower than Tesla annualize volatility led to sharpe ratio of 0.7
Definition: Sharpe Ratio
Beta
Beta measures historical sensitivity of a strategy to movements in its benchmark:

How much return of the strategy comes from market-correlated movements with an increased volatility?
A beta 2 means basically we fully correlated with market and move 2 times more volatile than market. A beta of 0.5 does not mean the strategy will always move exactly half as much as the market. It means that historically its statistical sensitivity to benchmark movements was approximately half as large.
Definition: Beta
Chapter 3 - Why I Start With Drawdowns
My strategy-selection process starts with downside. Before asking how much a strategy made, I want to know the following:
How much could I historically have lost, and how long would I have waited to recover?
There is a simple mathematical reason.
Suppose $100 grows by 20%:

Then the market falls 30%:

Then it rises another 30%:

The complete return sequence is:

Complete sequence grow only +9.2%. Now imagine that instead of losing 30%, we lose only 20% and our sequence looks like:

We finish with $124.80 instead of $109.20. A difference of only ten percentage points during the drawdown creates a dramatically different long-term result. This happens because losses and gains are asymmetric.
I know how simple and naive it sounds, but that is the most important question of capital investment. How to preserve capital in market stress periods. If you can time stress and preserve capital, you can make an enormous difference in capital management and results. It is where I aim with my quant strategies.
Chapter 4 - How I Select Strategies in Practice
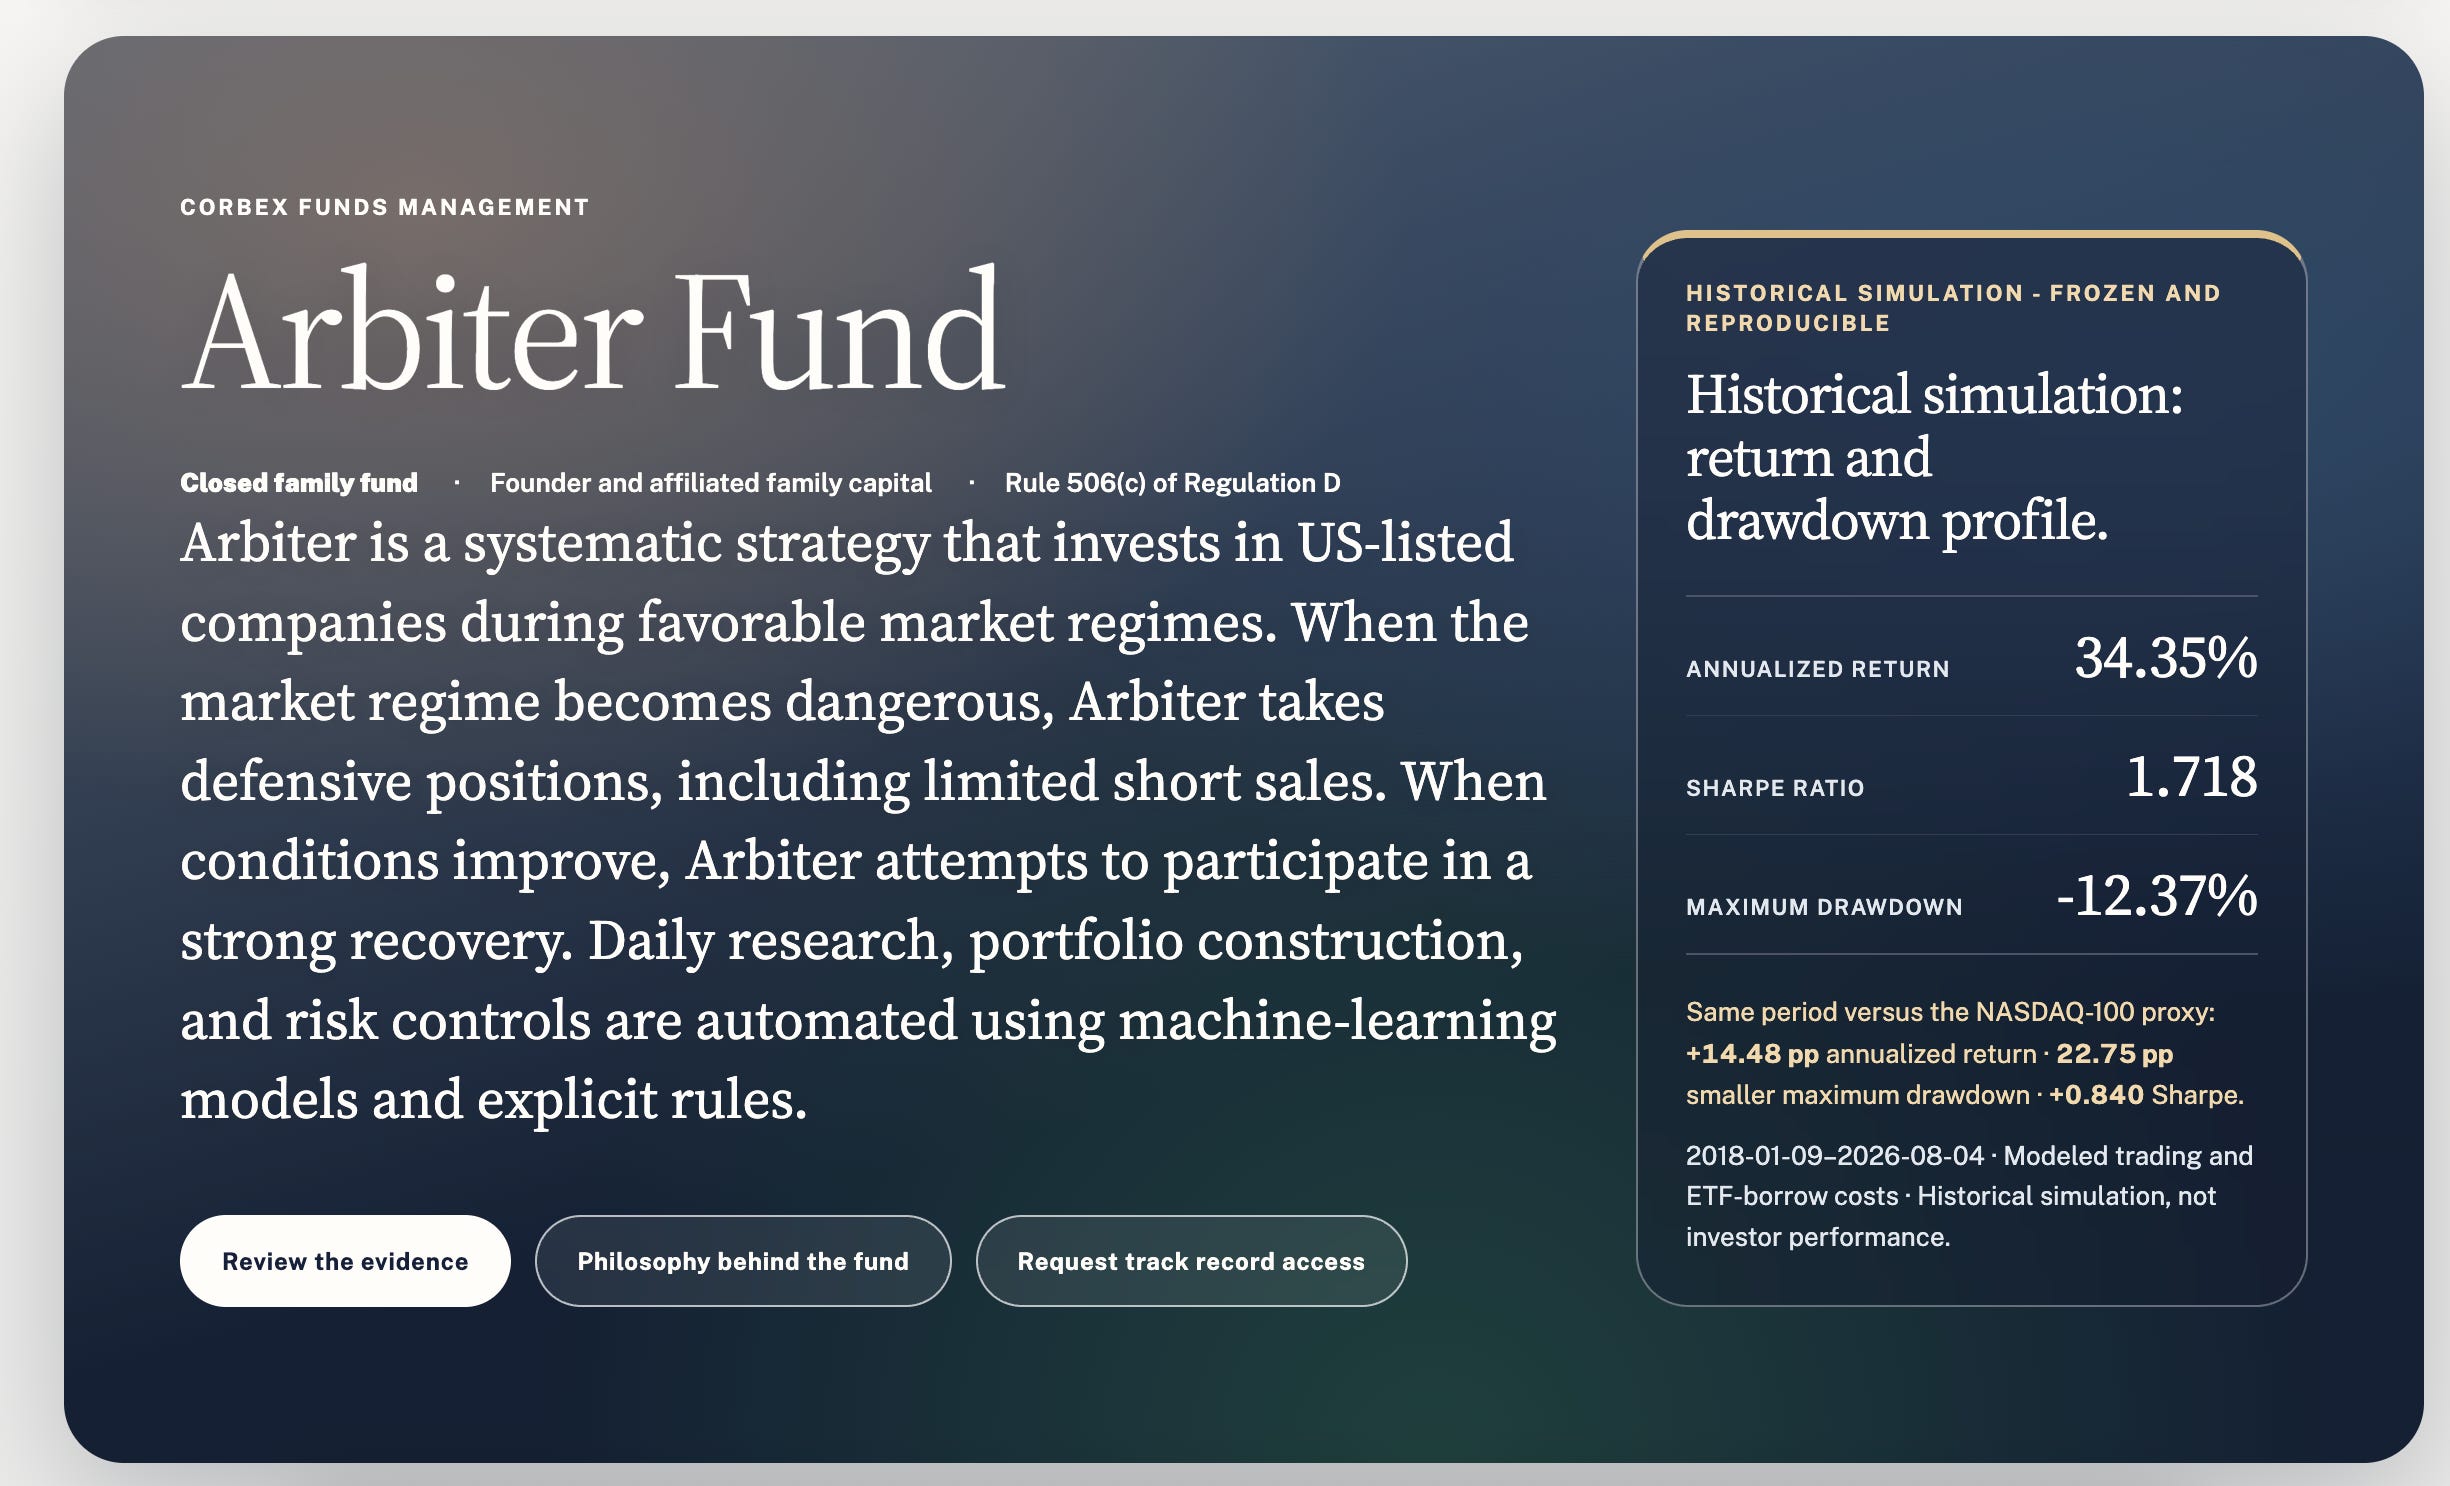
To demonstrate strategy selection I will use strategy that I developed to manage capital in US Equities. Internally It has name “a1edd” (a hash sequence of the model). It became the historical research basis for the Arbiter strategy at Corbex Funds Management.
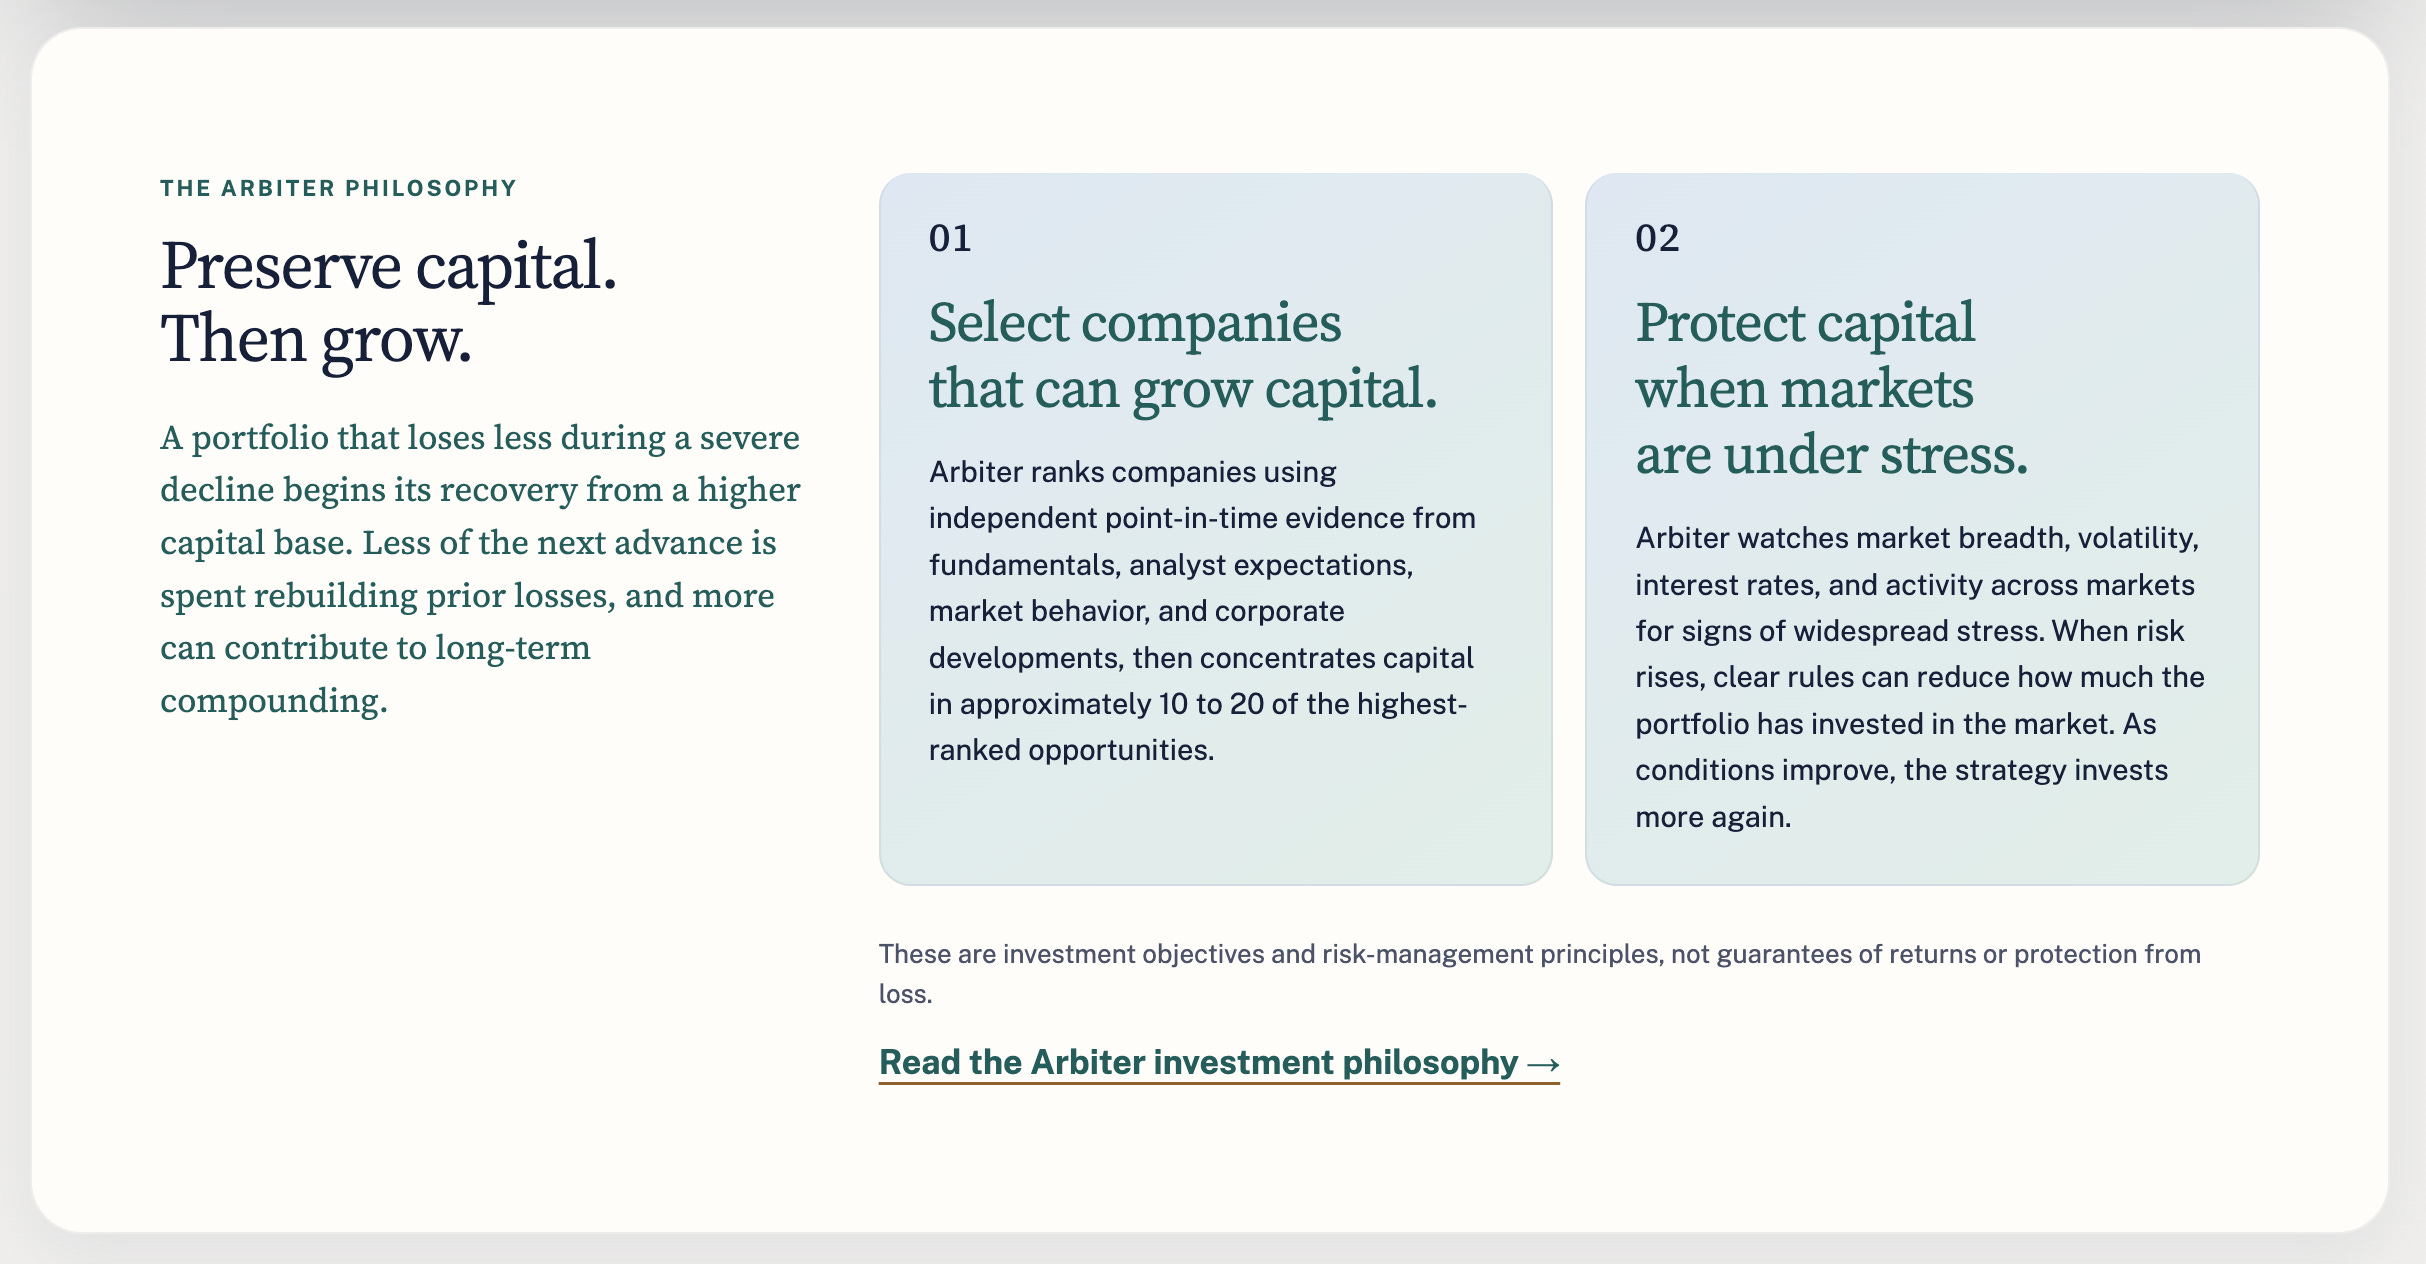
Its purpose is first to compress market drawdowns, and only then to invest into promising companies using fundamental and quantitative analysis with medium-to-high concentration. As I describe strategy on Arbiter Product Page.
It was one of dozens of strategies and variations I evaluated. The published historical simulation currently reports approximately:
34.3% CAGR
−12.4% maximum drawdown
2.77 Calmar
Sharpe around 1.7
substantially lower drawdown than its benchmark.
All historical results are simulated and include the declared transaction-cost and borrowing assumptions.
Now to the selection process. Benchmark for the strategy is NASDAQ.
1. Maximum Drawdown
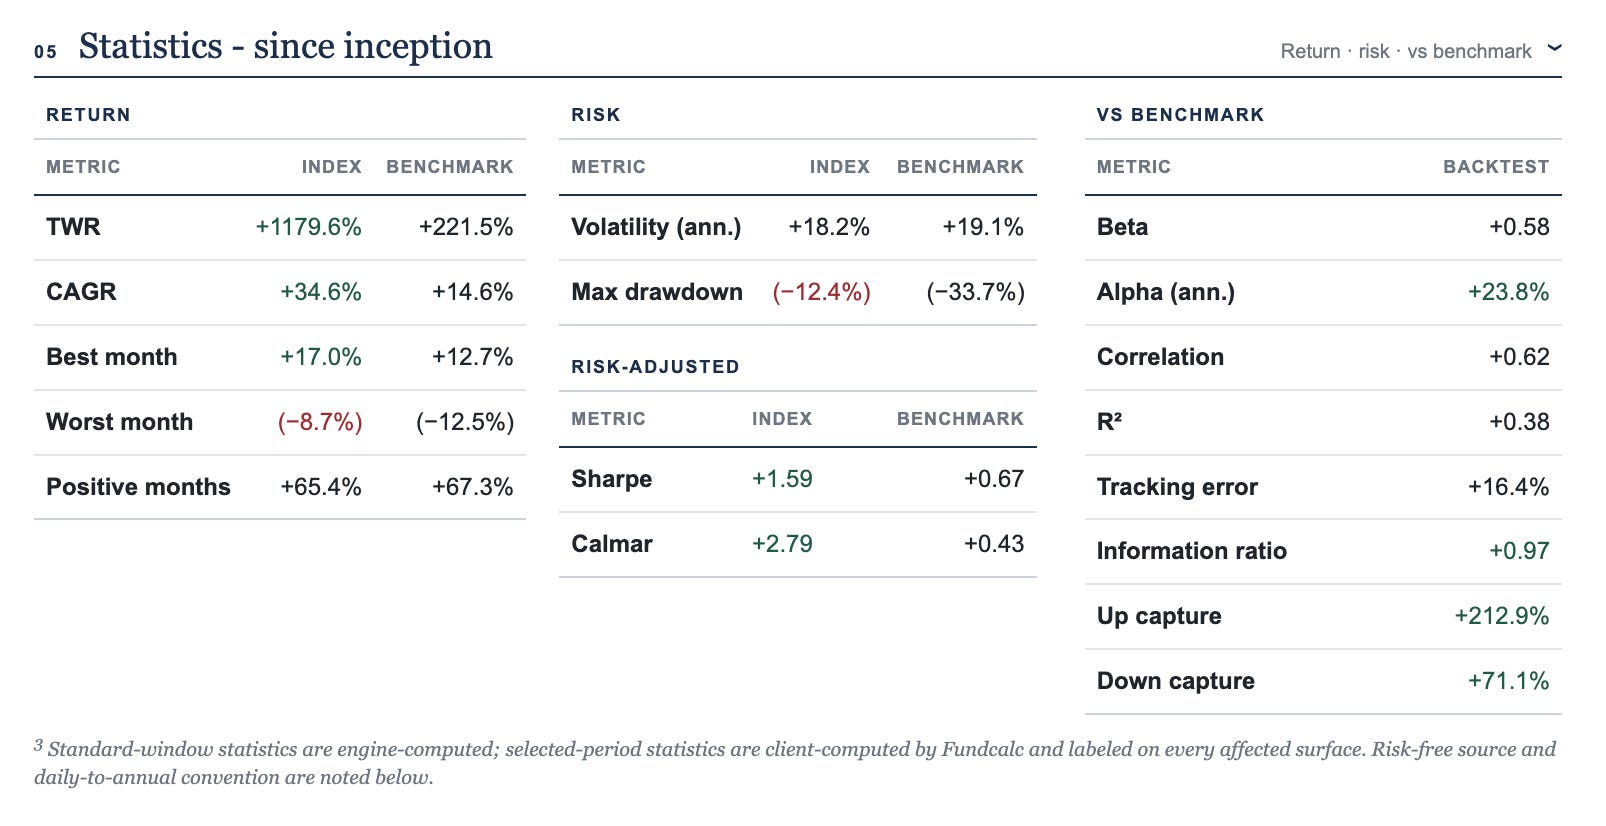
This is my first filter. The a1edd simulation experienced approximately −12.4% maximum drawdown, while the benchmark drawdown in the attached report was approximately −33.7%.
That means the strategy historically experienced roughly one-third of the benchmark’s maximum loss. My target for this type of strategy is approximately:
2–3× lower maximum drawdown than the market.
This is not an industry standard. It is my personal capital-allocation requirement. It is aggressive and on the edge of possible in capital management industry. But it is aligned with my values and personal requirements first, so it becomes a first hard constraints for me to develop quant strategy and select in practice.
2. Time Underwater
A strategy can defend extremely well by becoming too defensive and then failing to participate in recovery. That is why the second measure I review is underwater duration.
The five worst historical a1edd drawdowns in the attached simulation recovered in roughly 121–207 calendar days, with the worst listed episode lasting 207 days (or 142 trading sessions) from start to recovery. For systematic equity strategies in my universe, I generally consider a recovery period below approximately 200 trading sessions very attractive.
I want the strategy not only to reduce the loss, but also to move back into the recovery phase with the market.
3. Calmar
After the drawdown test, I reviewed Calmar ratio. The simulation reports of Calmar ratio above 2.7. Compared with approximately 0.43 for the benchmark in the report.
My general target is:
Calmar > 1.5 after the strategy has already passed the drawdown test.
Recap
At this stage, notice what we have done. We have defined:
maximum acceptable loss;
acceptable recovery time;
return relative to the worst historical loss.
We still have not selected the strategy based on maximizing return. That is intentional. Return is a result of good risk control and equity allocation. Risk control goes first in selection. Returns are emergent phenomenon of capital markets in my opinion (this is another topic, for another day).
After Reviewing the Risk Then I Look at Returns
Once the downside profile satisfies me, I move to upside.
4. CAGR
The attached historical simulation reports approximately:
Arbiter CAGR = 34.3% versus approximately: Benchmark CAGR = 14.6% under that report’s benchmark convention. Almost 20% excess returns over the Benchmark.
My requirement is much simpler than “maximize CAGR.” I first want CAGR to be competitive with the benchmark or better. If I can achieve market-like growth while losing substantially less during stress, I already consider the strategy interesting. If I can reduce drawdowns and improve CAGR, the result becomes significantly stronger.
5. Sharpe Ratio
Next I look at the quality of the return path. The a1edd simulation reports:
strategy Sharpe: 1.59 or 1.72 (considering different risk free rates, depends on methodology of measures)
benchmark Sharpe: 0.67
My preferred target is approximately:
Sharpe > 1.5
Sharpe is useful here because the strategy has already passed my economically meaningful downside tests. I do not select a strategy simply because it has a good Sharpe ratio, I select strategies that passes first 4 filters and then apply Sharpe ratio filter.
6. Beta
Finally, I examine how dependent the strategy is on the market. The a1edd simulation reports beta of approximately 0.58, with correlation around 0.62.
Lower beta combined with strong CAGR is interesting because it suggests that the historical return was not simply the result of taking more market exposure.
But beta is statistical and important measure of how correlated with markets we are and how depends we are on market returns overall. That is why I still consider actual historical drawdowns more important, because timing of divergence from market correlation is more important than just beta measure itself.
Chapter 6 - My Selection Funnel
The process can be summarized very simply:
Values
What investment experience am I actually looking for? Define key measures constraints and values. Define each of these
Maximum Drawdown: How badly could the strategy historically hurt me?
My answer: 2-3 times lower than benchmark.
Underwater Duration: How long did I have to wait to recover?
My answer: under 200 days.
Calmar: Was historical compounding large enough relative to the worst loss?
My answer: above 1.5.
CAGR: Did the strategy produce enough growth?
My answer: above benchmark.
Sharpe: Was that growth statistically attractive?
My answer: above 1.5.
Beta: How dependent was the strategy on the market?
My answer: below 1.
Combining these requirements step by step we control for risk management first, then we select competitive strategy on return (CAGR similar or better than benchmark) and then we use statistical measures to control for volatility and market correlation.
That is conclude strategy selection framework that I use. This is opinion formed in multiple years of testing and selecting quant strategies and it led to selection of strategy a1edd to build Arbiter Strategy.
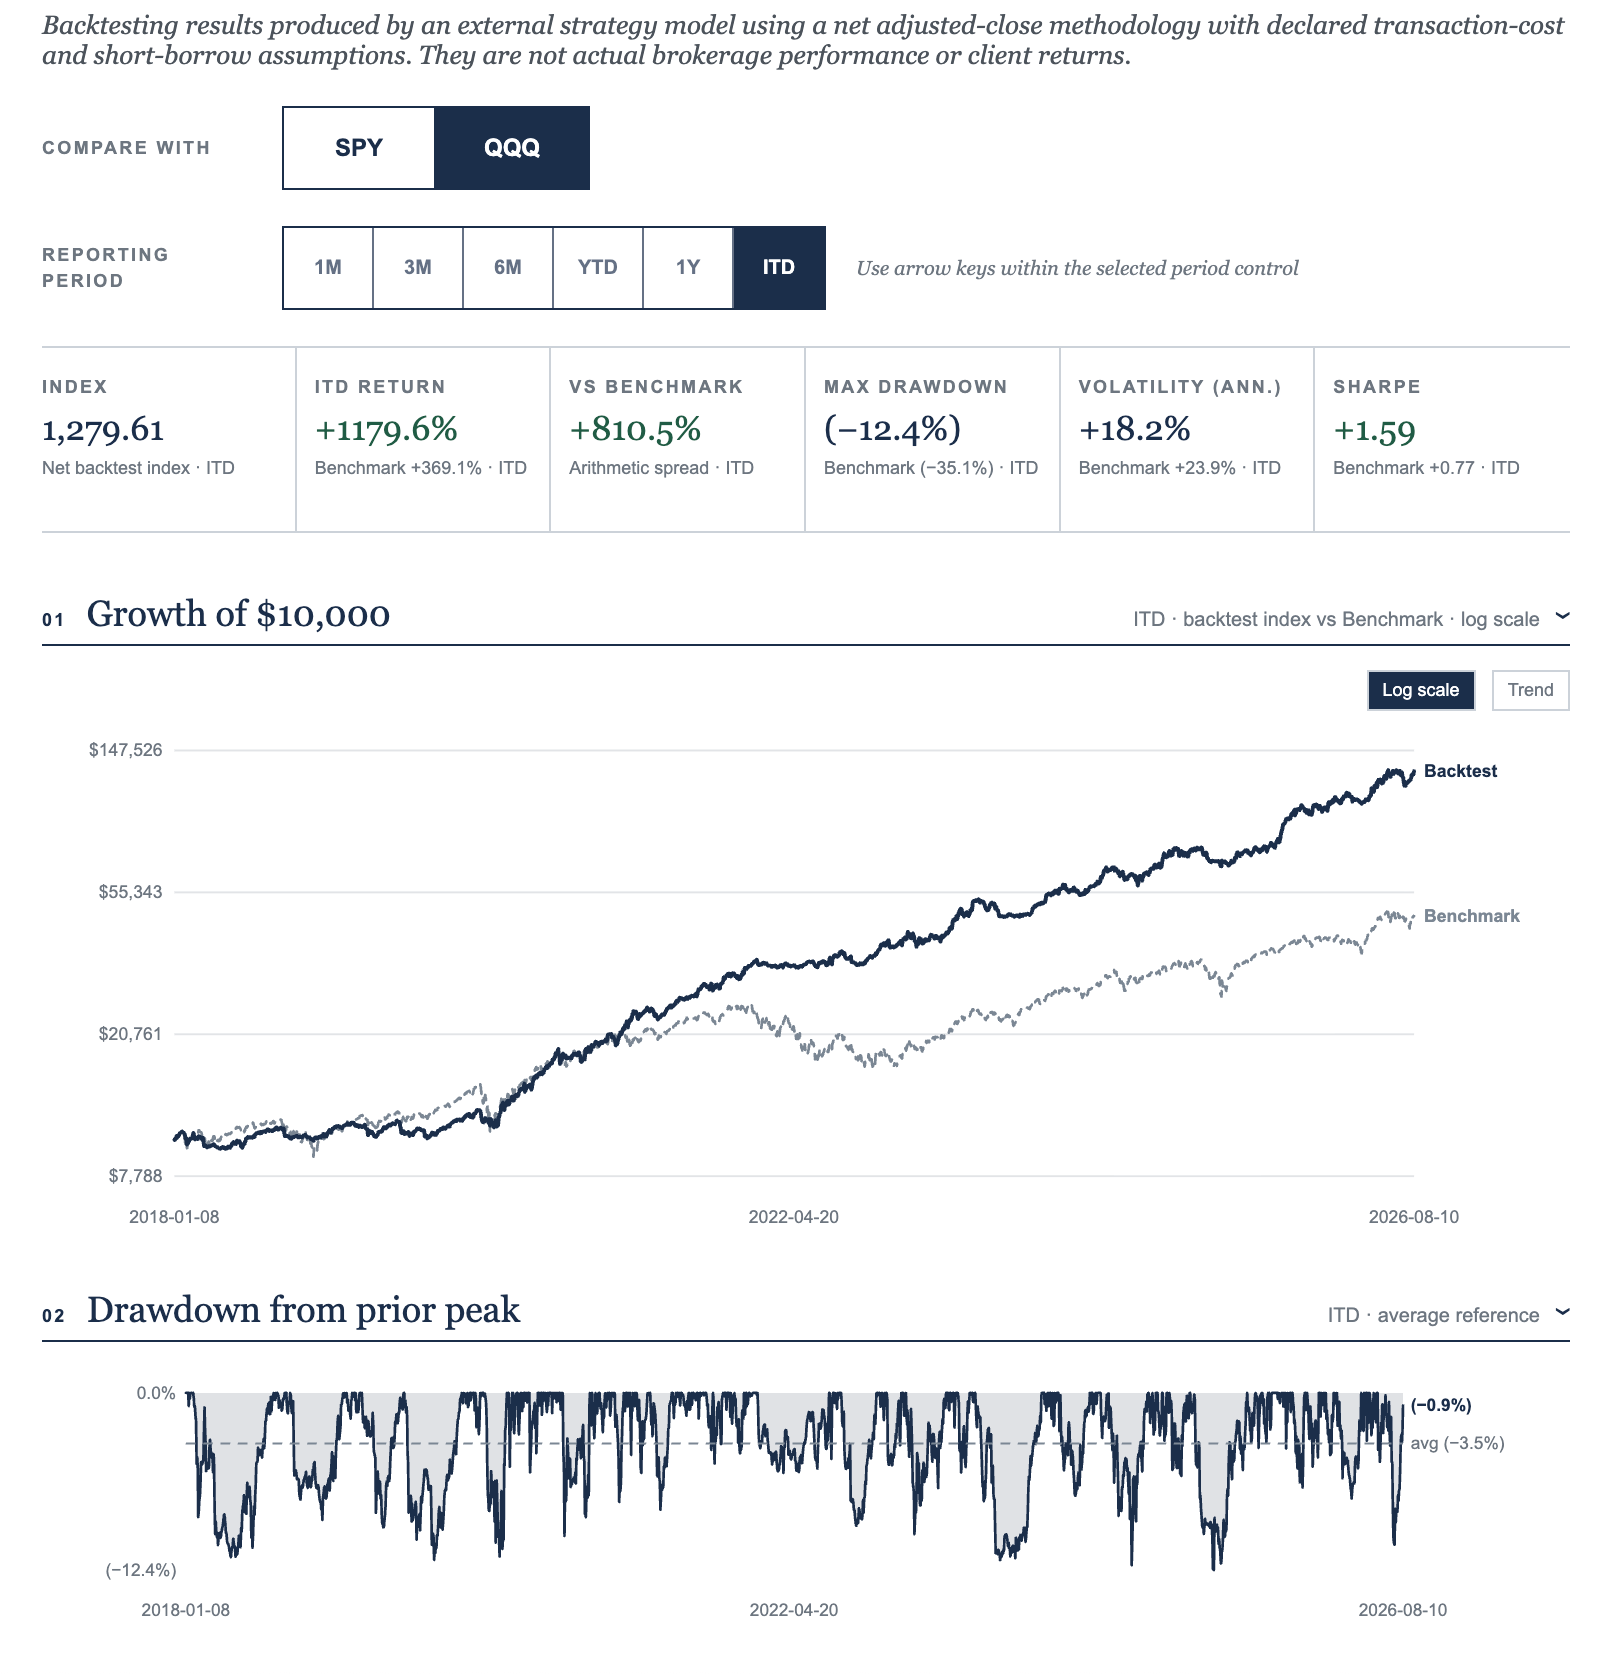
Below is a screenshot from Arbiter Strategy Reporting tool that I use at Corbex Funds Management to review historical simulation results.
Chapter 7 - What This Does Not Solve: Overfitting
There is one important problem this framework does not solve. And it never intended to solve. In Machine Learning and Finance Overfitting is very well known phenomenon. A strategy can have beautiful CAGR, Sharpe and drawdown statistics and still be useless if thousands of strategies were tested and only the best historical result was selected. That is backtest overfitting.
Therefore, performance metrics are only one part of strategy selection.
A separate validation process must address:
multiple testing;
parameter sensitivity;
data leakage;
out-of-sample evidence;
Deflated Sharpe Ratio;
robustness;
and ultimately prospective live performance.
I intentionally leave that discussion for another article. The important distinction is:
A strong backtest is evidence. It is not proof.
At Corbex Funds Management I built sophisticated testing techniques to test strategies for overfitting, including adoption of very well known work on Deflated Sharpe Ratio and other work by Marcos Lopez de Prado.
Conclusion
When most people compare investment strategies, their eyes naturally move toward the largest positive return. Mine increasingly move toward the largest negative number.
I want to know:
How much did we lose?
How long did it take to recover?
How effectively did the strategy compound relative to that loss?
Only then do I ask how large the return was.
My philosophy is:
Give the market the opportunity to work for you.
Markets already do an excellent job of producing long-term growth and allocating capital. My job as a portfolio manager is not necessarily to replace that mechanism. My objective is to identify systematic strategies that can reduce painful drawdowns, participate in recovery, and potentially add an additional return edge.
For my own capital management approach, the hierarchy is simple:
Protect against the downside.
Recover reasonably quickly.
Let compounding work.
Then add edge.
The a1edd/Arbiter historical simulation passed the performance filters I established for the type of systematic strategy into which I am willing to deploy my own family capital. That does not mean historical performance will repeat. It means its historical behavior is aligned with how I want my capital to behave. And that, to me, is where strategy selection should begin.
I now use Arbiter for daily live trading. Arbiter generates the market strategy, and Corbex’s proprietary system automatically executes the trades under my review. By goal now is live deployment of that strategy and demonstration of how it works with real capital in market conditions.
Reading list recommendations
Disclosure
This article is for educational and informational purposes only and does not constitute investment advice or an offer or solicitation to buy or sell securities.
The results discussed are historical simulations and not actual investor returns. Simulated results depend on assumptions regarding data, execution, transaction costs, borrowing and portfolio implementation. Past performance, whether simulated or actual, is not indicative of future results.